




Having got into some big picture themes from market and macroeconomic points of view in our recent research and investment views, it’s time again to hear from companies as they report their half year results. We’ll get into the detail from businesses below, but from a market perspective there has been plenty to discuss too.
Some of the rapid gains in semiconductor and datacentre-related companies have been put into reverse, particularly over the last fortnight. With the market having essentially bifurcated into ‘AI’ and ‘everything else’, and with the portfolio being weighted toward the latter, we have seen a strong bid for portfolio companies as capital appears to have swung from one side of the equation to the other. Whatever part of the market we’re in, we look for the comforts of stable, high return on capital businesses that are trading at reasonable valuations. This has, frankly, been a barren place for returns over the last year, but suddenly these qualities seem to have become a bit more fashionable.
There is some way to go, and the line will not be straight, but a shift in momentum is certainly welcome. We don’t know what the next twists and turns of this quite wild market will be, indeed as we write on 30 July the market has whipsawed in the opposite direction. But if it’s solid operating results available at cheap prices that is desired, then we certainly have that in abundance. The divergence between the volatility in price of these companies’ shares and their underlying operations is quite striking. Revenue growth in the portfolio is coming in metronomically in the mid-single digits, if anything accelerating slightly at +6% on an organic basis on average with 35 of the portfolio’s 47 businesses having reported. Earnings per share are up ahead of revenue growth thanks to operating leverage and the effects of some quite large share buyback programs.
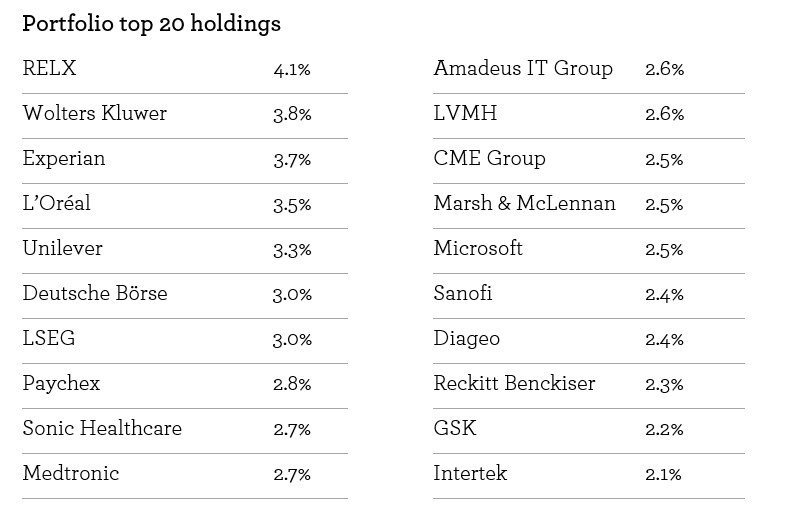
Below we will run through the headlines for portfolio companies, with their names highlighted so that you can skip through to those of most interest should you desire. For simplicity we’ve quoted revenue growth in organic terms, i.e. stripping out the effects of foreign exchange movements, acquisitions and divestments. If you’d like to know how much of the portfolio each business represents, we’ve added the top 20 holdings at the end.
On a portfolio management note, with much value in our investable universe we have broadened the portfolio out so you’ll notice that position sizes are quite compressed relative to each other (the majority of the holdings below the top 20 are sized 1.5%-2.1%). This speaks to the opportunity laid out in front of us, which we’ll return to after a trip through the results.
Industrials
Elevator service company Otis is actually an example where profit growth was behind its +6% organic revenue growth, as the company invests behind its service organisation. The company sells new equipment, which accounts for about a tenth of profit and has been impacted by weak sales in China. Management expect a return to growth for this division in the second half of the year, but the big story is in the service business where there had been a degree of underinvestment that is now being addressed at the expense of some profit margin. We initiated the position this year and have built to 1.7% of the portfolio as the share price has been weak on the back of these negatives, which we think are perfectly solvable.
Another new position this year is Honeywell International, which has recently spun off its aerospace division, and we retain both companies at small positions of 1% of the portfolio each. The remaining Honeywell International company is an industrial automation business with a broad portfolio of hardware, software and systems for things like industrial process control and automated building management. In its first set of results as a slimmed-down firm it reported +4% organic revenue growth, profit growth of double that and improved its post-spin margin targets. We don’t expect Honeywell to be a high growth business over the medium term, but it does have some good tailwinds as its products target energy and resource efficiencies for its customers. That said order intake is in the double digits currently, helped in part by increased gas processing demand on the back of the war in Iran.
Toolmaker Snap-on is rebuilding revenues after a tough couple of years and grew +3% in the last quarter. Its Tools division that services individual mechanics grew by +3%, whilst the bright spot was Commercial and Industrial which services aerospace companies as well as general industry, up +11%. However, Repair Systems grew only marginally as carmakers slowed launches.
Whilst testing, inspection and certification companies SGS and Bureau Veritas are business services companies, we’ll mention them alongside the industrial companies they serve. Revenues came in +6% for each, and with Bureau Veritas disposing of a slower growth division, their expectations for the future have been upgraded. This sector has seen corporate activity as rival Intertek, which is also in the portfolio, has been bid for by a private equity firm. This demonstrates the lowly valuation at which the company’s stock was trading, and the attractiveness of the sector’s business model.
Business services and software
Business services is a catch-all term for a range of companies servicing different industries with varying offerings, addressing a diverse array of companies and business models. Many of these had been placed into the ‘AI losers’ camp but their operating results thus far are not showing signs of distress. In fact, it could be argued that businesses like Publicis in marketing and RELX in information services are seeing some benefits.
For Publicis, who grew revenues +5%, delivering marketing campaigns that are responsive to near term conditions - be it consumer trends or the weather - is facilitated by AI. Clients are considering how to capture traffic from chatbots that don’t currently have a direct advertising option. Optimising websites and content for machines as well as humans to read adds complexity, which enhances the role of the expert, independent intermediary. On the flip side Publicis’ consulting arm Sapient has seen a slowdown despite the promise of AI-driven efficiencies and opportunities that clients might capture. This is in part a reflection of the broader uncertainty being felt by businesses as the geopolitical situation has destabilised. The company also think that the scale and costs of the changes that AI implies is giving clients pause for thought, and in a sense that puts AI on a classic technology adoption curve; early adopters have been won over, now it needs to be sold to the interested-but-reluctant mass market.
US advertising rival Omnicom grew at a similar rate and seems to be progressing well with the integration of its merger with Interpublic. Linking spending to returns is critical for enterprises with tight budgets and tough targets. Continued solid results are a product of clients reinvesting technology-enabled cost savings as the value Publicis and Omnicom can provide to them improves.
Returning to RELX, it showed the consistent high single digit revenue growth to which we have become accustomed. In fact, growth for two of the ‘AI underdog’ divisions, Legal and STM, accelerated. On the AI opportunity, management noted “the ongoing evolution of artificial intelligence is enabling us to add more value to our customers, to develop and launch higher value-add products at a faster pace and continue to manage cost growth below revenue growth. This evolution has been a key driver of our business for well over a decade and will remain a key driver of customer value and growth in our business for many years to come.”
Insurance broker Marsh & McLennan grew revenue at +5% despite a slowdown in its main risk broking business. It was helped by its diversified portfolio, with Management Consulting growing thanks to advising on AI, perhaps a leading indicator for other consultants. Meanwhile, payroll and HR outsourcer ADP grew revenue +6% which was broadly strong across its many different offerings, retention rates stayed high and margin improved. New bookings have been coming in at a similar rate, so any AI-related jobs disruptions (a fear stalking the market) seem to remain in the future.
In financial markets, Deutsche Börse grew revenue at +9%, with its fund services and clearing particularly strong. The company set a confident tone at its capital markets event at the end of 2025 and is making good on its promise of double-digit operating profit growth. It is experiencing economies of scale on the back of investments made in its platforms in previous years.
Turning now to software, the area of the equity market most harried by fears around AI, enterprise resource planning firm SAP grew revenues by 11%. Importantly, its cloud offerings grew +24% and its backlog of work to be delivered grew ahead of this. Most of this growth is driven by existing customers upgrading from old systems with very high retention and cross/upsell rates, and the backlog remains large. Further growth from new product development offers longer-term upside. Profitability has been marginally affected by hiring and deployment of AI tools (with the associated spend on tokens), but this is expected to reverse with some simple optimisation efforts, like swapping out the expensive frontier models for low-cost versions without any impact on functionality, a trend we have heard from many companies, including the tech giants themselves.
Microsoft’s shares have been quite weak this year as the market looked for returns on the vast sums the company is spending on datacentres. There is some evidence that this hyperscale company is getting something in return, with +18% revenue growth led by its cloud operating system Azure and driven by AI adoption. There are nuances and questions – how sustainable is the demand from its partner OpenAI? Will the company stop spending should demand growth moderate? Management have been clear and strike a practical tone. CFO Amy Hood on the earnings call made the very basic point that they can “just slow down” spending on ‘short lived assets’ which account for most of costs, i.e. AI processing chips and the like, should the conditions dictate. But there are longer lived assets being procured as well and there is no guarantee of the right action at the right time. We would have a bigger position than the 2.5% currently in the company if some of these questions were resolved. That we have a position at all is - outside of the strength of its core business - in part due to the fact that so far the company has been able to fund its physical expansion from its cash flow, unlike some peers, and those cash flows come from a diverse range of sources. The forecast for the next period is for more of the same in impressive growth and continued spending, so we keep a close watching brief.
Qualcomm is the portfolio’s small exposure directly to the semiconductor business. It is an interesting case where there are some well-known headwinds from its business that sells tech into mobile phones (particularly modems), but some clear longer term growth opportunities that play well into its structural advantage of chips processors with high performance per watt. In the last quarter the pressure on handset makers that is coming from high prices for components, especially memory, came to bear on the company and revenues fell -4%. Our investment thesis is not built around the handset business though and the growth areas are growing. Sales into Automotive were up +61% and sales into the ‘Internet of Things’, i.e. all sorts of devices that these days need processing and connectivity capabilities, were up +9%. The company’s stock has been on a bit of a rollercoaster ride that has limited our position size, but with it trading cheaply there is scope to add to the position over time.
Consumer Goods
The Consumer Staples firms have reported generally solid results that are improving following the inflation-induced challenges of the post-covid era, but there are still pockets of weakness. US behemoth Procter & Gamble’s (P&G) sales were flat. Having been the fast-moving Consumer Goods company du jour over the previous couple of years, it’s now at the back of the pack and is working to stabilise its market share, partly due to competition emulating their successful strategies. We think it can do this given its portfolio of brands, clout with retailers and promotional heft. There have been some better areas such as its Beauty division, and the outlook is for a return to revenue growth in the coming year. Giving some evidence that Consumer Goods firms all go through their own particular cycles, UK-listed Unilever has seen sales growth accelerate, having previously been more in the position P&G finds itself in now. There has been a lot of portfolio activity at Unilever, most recently arranging to merge its food division into US-listed McCormick, and if the quarter’s +6% organic revenue growth is anything to go by the strategy is bearing some fruit.
Elsewhere in the consumer landscape L’Oréal turned in a solid +7% revenue growth, being particularly strong in professional and dermatological products, and geographically China grew double digits despite ongoing consumer weakness, quite the turnaround. Europe grew by +6%, helped by a strong performance recruiting new consumers online in a sign of the times for how consumer firms interact with their customers.
Luxury firm LVMH saw improving trends, returning to growth with a particularly strong performance in the US. Its important Fashion & Leather Goods division is on an upward trajectory, as is Wines & Spirits, and Watches & Jewellery was strong driven by Tiffany. Overall growth is still quite restricted but as a business that has had a lot of questions asked of it in terms of the long-term appeal of its categories and brands, the improvement in operating performance starts to provide some answers.
Health Care
The Health Care sector has seen the pharmaceutical portion of the portfolio report, and it has been pretty steady, which is how we like it. GSK grew revenues +5%, Roche by the same, and Sanofi by +18% thanks to wonder therapy Dupixent. For Sanofi, Dupixent is a boon and has a reasonably long runway ahead of it but its dominance of the firm raises the question of what ultimately replaces it. New CEO Belén Garijo has directly acknowledged the need for improvements in the firm’s pharmaceutical pipeline and is investing behind it. One might think this is bread and butter stuff for a pharmaceutical company, but sometimes a fresh look can help to move things along. GSK went through a similar process, albeit from a different starting point under prior CEO Emma Walmsley, with the baton recently passed to the new incumbent Luke Miels.
Of the health services companies, Quest Diagnostics has reported so far with very solid +10% revenue growth. Underlying medical testing volumes in the US are growing at around 4% per year, but the company is executing its expansion strategy partnering with health systems. There is plenty of opportunity still for above market growth by winning currently in-sourced testing business from hospitals. There is also a small but fast growing direct-to-consumer testing service helping the numbers upward. We don’t expect double digit revenue growth to be the norm, but these tailwinds should sustain mid-high single digit growth over time.
The opportunity
Hopefully the above has given a sense that the portfolio’s +6% revenue growth is broad based across sectors, sub-sectors and end markets. We see earnings and cash flow growth ahead of this. Whilst we can’t guarantee there will be no variance in the picture in the future, we equally see no reason to suspect similar levels can’t consistently be achieved over the medium to long term.
Is everything going perfectly? No, as P&G will attest, but the vast majority of the portfolio is delivering well. Is it the super-normal growth that’s being seen by some areas of the market, particularly semiconductors? Not that high, but is it good, solid growth that is highly durable and sending lots of cash back to us as shareholders over time? Absolutely.
Importantly, the price to access these cash flows remains cheap. Even after the market’s sudden enthusiasm for high and stable returns on capital the expected free cash flow yield[i] for this year is 6%, still a very high level and well ahead of the portfolio’s history and its fair value. For the market, despite all the noise and excitement of the recent semiconductor sell-off, the figure remains very low at 3.2% and testing the bottom of the market’s historic range. This simple, but effective, view of valuation is corroborated by our other measures and modelling, focused on compounding of free cash flow. At these levels, we think that most holdings could approximately double over five years with reasonable assumptions given the dividend yield, buyback yield and expected growth, driven by their fundamentals alone and without a valuation re-rating[ii].
Ben Peters
30 July 2026