Happy new year to all of our co-investors and readers. 2021 surely can’t turn out to be more dramatic than 2020 can it?
We’re giving it a pretty good go so far. We have two new highly transmissible strains of SARS-CoV 2 to deal with, the associated re-locking down of economies, travel bans, and to top it off the surreal and troubling scenes at the US Capitol Building. And we’re not even half-way through January. In response, the equity market has continued the vacillations of the prior year, with investors reappraising the returns on offer from disparate companies that experienced startlingly varied fortunes over the past 12 months.
2020 – Year of the outlier
Last year was peculiar in many ways, but narrowing our focus to equity returns we see an increase in the dispersion of returns in the market. That’s not particularly surprising; in times of turmoil inter-stock volatility tends to rise as the market tries to sort out the winners from the losers, and 2020 was undoubtedly tumultuous. A more interesting observation is to dissect what caused the market’s impressive positive return, seemingly against the economic gods. In sum, the answer is outliers. Here we’ll look at some of the highlights from the MSCI World index. All data is from Factset, with total returns in sterling.
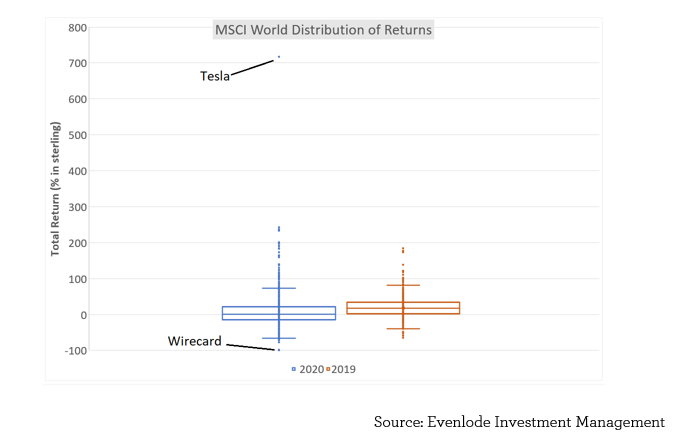
Naturally the market had some winners and losers as in any year, but the winners won big and the losers really went the extra mile. Perhaps cruise operator carnival and aircraft maker Bombardier can be forgiven for their share prices being down 71% and 77% respectively given the circumstances, but fraud-struck payments firm Wirecard can’t blame a virus for its 99% decline.
On the side of positive returns things were no less dramatic, with the star prize going to Tesla, up 717% on the year. Sometimes companies with good fortune strike gold and their valuation multiplies, but usually they’re quite small. Tesla is not small in market capitalisation terms; it makes up 1.2% of the MSCI World index at the current time and contributed fully one percentage point of the benchmark’s return all by itself last year. Whilst Wirecard made a good go at subtracting itself from the index in its entirety, it only detracted by -0.04 points.
If you’ll forgive the secondary school-level statistical exposition, here are the constituents of the MSCI World’s total returns for 2020 depicted on a box & whisker diagrami:
We’ve plotted 2019’s returns by way of comparison. The diagram depicts the greater dispersion of returns in 2020 over 2019 (evidenced by more ‘outliers’), which was a year of strong returns itself with the MSCI World index up in the mid-twenties. The positive skew of returns last year can also be seen, but there are some stats that show the super-normal pull of those big returners in 2020.
First, whilst the market index returned 12.3% in sterling terms, the mean (i.e. unweighted for market capitalisation) return in the market was 6.1% and the median just 1.3%. This shows not just the positive skew of returns but also the significant ‘Tesla effect’. Big companies were the ones making the big returns.
A data point that exemplifies the effect is to count the number of companies that one needed to invest in at their respective index weights to capture the return of the market, if one were fortunate enough to select just the most positive contributors. Last year, just 47 of the index’s 1,775 companies would have done the trick (with the rest of the market returning zero in aggregate). In 2019, it would have taken 804 positions. The market return was bigger in 2019, but this difference is material and represents a dense concentration of returns.
How concentrated were the returns? To get a sense, asking the same question but only seeking to capture half of the index return, in 2020 just four companies would have done it for you: Apple, Amazon, Microsoft and Tesla. In 2019 it would have taken 85 companies.
Microsoft’s total return was ‘only’ 37%, puny compared to Tesla but it’s a very big company (market capitalisation $1.7tn, a full 3% of the index) and it was very comfortably ahead of the average. It contributed 1.3 points of the market return.
Why are we spending time on this game of equity market Trivial Pursuit? In part it’s just interesting (at least, we find it interesting). The four companies accounting for half the market return are big technology-driven companies, a sign of the times perhaps. Tesla is a fascinating business, is it just a car company, or is it something much more? The market is erring toward the latter.
But more importantly the MSCI World index is our performance benchmark, and the portfolio we manage on your behalf lagged it over the last year. Understanding the ebbs and flows in part explains why and helps contextualise the portfolio’s performance. Let us now turn the lens on the portfolio itself.
Finding the middle ground
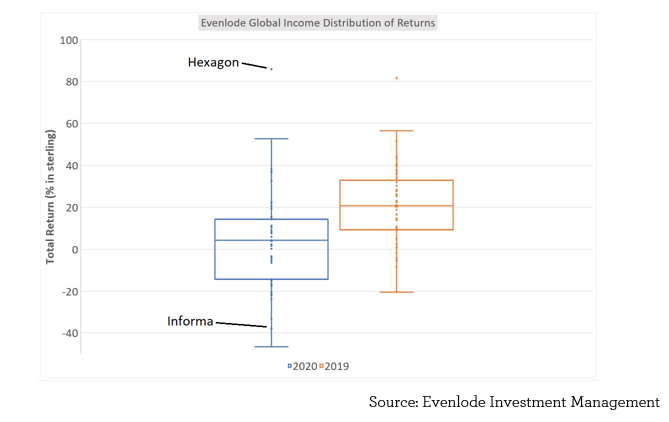
We shouldn’t subject the market to an analysis that we wouldn’t put ourselves through, so here is a similar depiction of returns from the Evenlode Global Income strategy:
The spread of investment returns increased within the portfolio in 2020, not too dramaticallyii but the chart shows that the increase in spread was downwards. The downwards movement in a Covid world is not so surprising with the benefit of hindsight as we look back over the last year and the turmoil it brought. That the spread did not expand more is also understandable as we look for businesses with certain qualities; no matter what the sector, the businesses within the portfolio are cash generative, have high returns on invested capital, good competitive positions and relatively low levels of leverage. We also naturally find such companies in a narrower range of sectors than those addressed by the broader market, so one would expect a narrower set of outcomes. We give more detail on sector performance below.
Even so, there were winners and losers. On the negative side, global events business Informa fell by the most as meeting face to face was outlawed and events got cancelled (we exited the company in the global income strategies during the year but retain a position in the UK-focussed Evenlode Income fund). Technology company Hexagon was the standout performer, one we initiated as a holding during the market downturn last March and which has rebounded very strongly since.
Examining the averages, the mean total return of a portfolio holding was 4%, and the median 4.3%, close to the fund’s overall performance for 2020 of 3.5%. So the portfolio has forged along the middle ground overall, some kind of happy medium, between extremes of return and without significant skewing from large positions moving one way or the other.
All this makes sense considering the Evenlode investment approach. Steady companies that churn out cash and grow a bit each year are our bread and butter. Some grow faster than others, and sometimes companies don’t grow either because they are exposed to the economic cycle or because they are seeing some other disruption, as Informa shows. We don’t get everything right of course, but extremes of performance are relatively rare; slow and steady is more the order of the day.
For this reason, we often say that the Evenlode strategy is likely to lag a strong market, and the global equity market has been strong particularly compared to the global economic performance. But as we’ve seen, it’s been strong in a concentrated sort of way over the recent past, and so our expected performance profile has been magnified a little.
This exposition has been mainly market-focussed. We are fundamentally business-first investors and prefer to discuss what’s happening at investee companies over what’s happening in the market. One useful thing the market does give us is a price though, which we can compare to the value we expect the portfolio to generate in free cash flows over the long term. This part of the equation stacks up very well for the portfolio at the current time, with a portfolio free cash flow yield of around 5% and the prospect for growth through time despite 2020 causing something of a dent for some companies thanks to coronavirus.
Ben Peters, Chris Elliott and the Evenlode team
12th January 2021
Please note, these views represent the opinions of the Evenlode team as of January 2021 and do not constitute investment advice.


