Part 1
Most investment philosophies and processes major on a small number of factors and these factors become the primary focus and the main selling point. However, there are many successful ways to invest. Whilst we have our primary focus, there is value to be found in analysing a wide range of styles and incorporate the best bits into the way we invest.
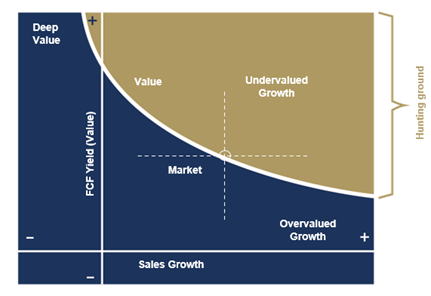
The factors we refer most to are value and growth. We are looking for companies that grow faster than the market and have cheaper cash flows than the market. That is what the following chart depicts, and we tend to lead with this when we discuss our approach.

One of the most successful approaches over the last decade has been investing in high-quality companies. These companies tend to have characteristics including solid growth from repeat purchases, defensible market positions (economic moats), consistency of returns irrespective of environment, ability to reinvest and compound at high rates of return and sound balance sheets. Leaving price to the side, who doesn’t want these qualities in an investment?
The financial metric which best captures a high-quality company is a consistently strong return on capital employed. The logic is irrefutable. If I as an investor give Company A £1 of my capital, I want that company to invest to make a return higher than that which I can earn passively elsewhere – the higher and more consistent this return the better.
There are many ways of measuring return on capital – Cash Flow Return on Investment (‘CFROI’), Return on Invested Capital (‘ROIC’), Return on Equity (‘ROE’) and Return on Assets (‘ROA’) are amongst the more widely used. Each has its advantages and disadvantages, but our preference is for CFROI as it focuses on cash, a more reliable number than profit.
When we look at a company for the first time, amongst many factors, we figure out what the growth/value trade off looks like but in the same exercise we also consider the quality of the company. Here is an example of the return on capital metrics we consider using Europe’s largest company, LVMH, as an example.
Consistent returns at a pretty respectable level would be our conclusion here. The entry price for this level of quality is a Free Cash Flow Yield (‘FCFY’) of 2.5% or if you prefer PE, 2021/2022 PE of 33.7x/30.2x.
To understand what the market is seeing in these high-quality companies, we observe two well known and very successful fund managers whose process is explicitly quality in nature. Each has strict criteria for what constitutes quality, and we use their universes as a screen of sorts to help us understand markets better. We are a bit nosy and keen to learn from successful investors as well as wanting to invest in this group of companies if the valuation of any stocks came into our range.
We track a universe of the 45 or so European stocks they hold and/or have held, hereafter referred to as the High Quality Basket (‘HQB’). The names included will be familiar – it includes LVMH and L’Oreal as well as other Consumer Goods companies (e.g., Hermes, Essilor, Nestle, Unilever), high quality Industrials (e.g., Kone, Schindler, Atlas Copco), Pharma & Medtech (Roche, Novo-Nordisk, Coloplast), Testing companies (e.g., SGS, Bureau Veritas) and stocks from a wide range of other sectors.
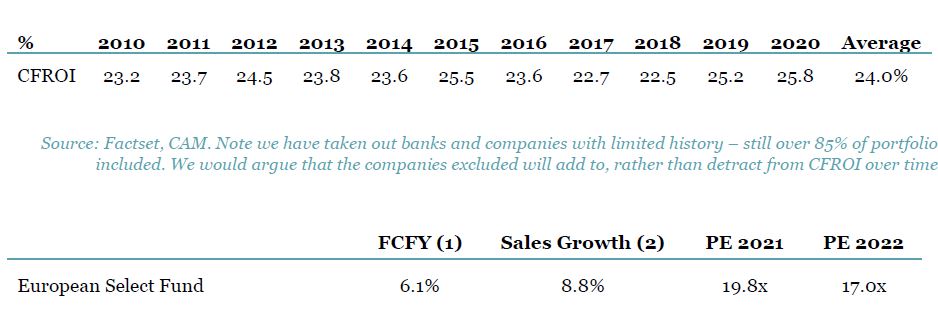
To avoid data overload, we will just now focus on CFROI. The average CFROI profile and valuation for these 45 companies, arguably the crème-de-la-crème of what Europe has to offer is as follows:
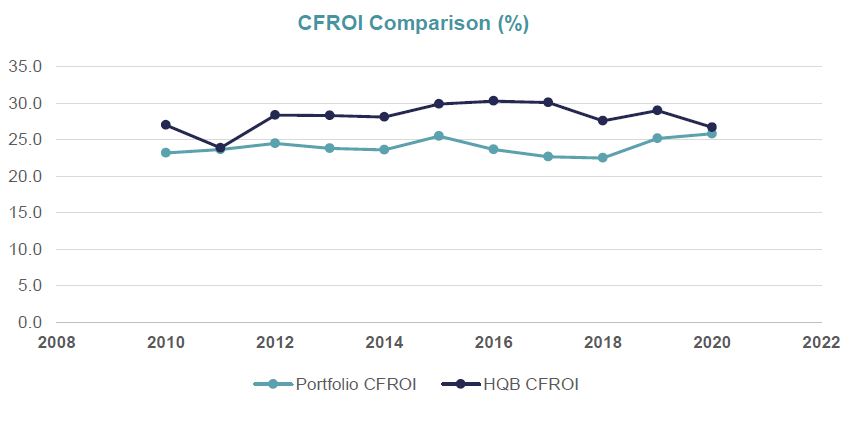
To access this HQB with a 10-year average CFROI of 28.0% you will receive a lowly 3.3% FCFY. Of note is that because many of these stocks dominate the market indices, the market FCFY on the same methodology is 3.7%.
Our portfolio is delivering a 10-year average CFROI of 24% with a not dissimilar level of consistency to the HQB. The big difference is the valuation we are receiving, a FCFY of 6.1%, close to double the HQB with a PE nearly half the HQB. Valuation matters.
There are many conclusions or comments that could be made on these sets of data. We would make 3 underlying points:
• Just because we don’t mention quality in our headlines doesn’t mean we don’t consider it
• The valuation the market is attributing to many of Europe’s high-quality business looks very high. Even if you don’t agree with that, there are many companies with comparable returns on capital and growth prospects further down the market cap spectrum - on much lower valuations
• We believe we have a portfolio of undervalued quality – we just don’t refer to it this way often.
The valuation the market is attributing to many of Europe’s high-quality business looks very high, but there are many companies with comparable returns on capital and growth prospects further down the market cap spectrum - on much lower valuations. We believe we have a portfolio of undervalued quality.
Part 2
In Part 1 we argued that the market is overpaying for large cap quality growth stocks. Our portfolio has similar growth characteristics to the ‘market darlings’, only slightly lower quality metrics but is demonstrably cheaper in cash flow terms.
Here we deconstruct our portfolio with the objective of helping provide a bit more colour and understanding to what we own. As the reader is hopefully aware, we have a large cluster of IT Service stocks. This is how we play digitalisation and is, in our view one of the few cheap ways left of getting technology exposure into a portfolio. We currently have 25.6% of the portfolio across 16 holdings here.
We also have a collection of holdings which can broadly be categorised as Defensive in nature. These stocks help provide balance and diversification to the fund and we would expect them to help protect capital in the down part of a market cycle. Most of these stocks have lagged the market rise over the last year or so and we have had to work hard to keep weightings up as we believe they will play their part in long-term performance. This cluster includes all our Pharma holdings, Consumer Staples (Danone, Unilever, Essity), food groups (Ahold, Acomo) as well as Zardoya Otis, Tieto, RELX and Artefact, the latter being the subject of a bid and trading as quasi-cash. This group of companies is currently 31.8% of the portfolio.
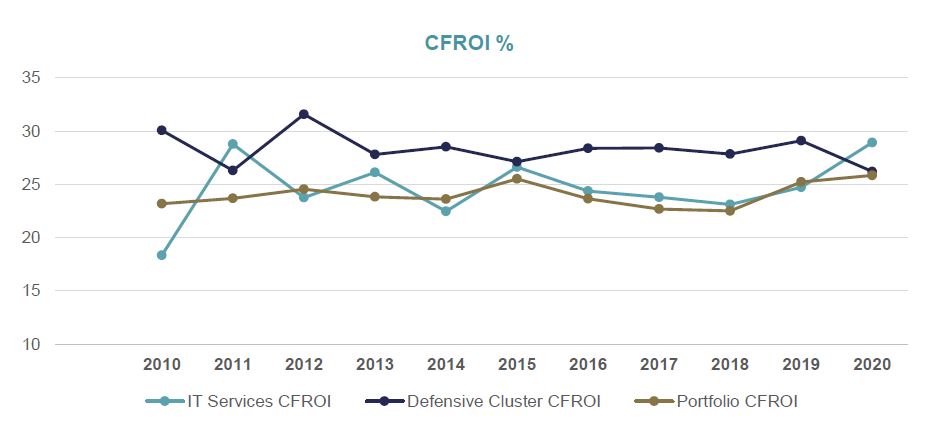
Focusing on Cash Flow Return on Investment (CFROI) of the different parts of our portfolio yield the following returns:
The portfolio overall has 10-year average CFROI of 24.0%. Perhaps not surprisingly, the defensive cluster has an above average 10-year CFROI of 28.3%. The other big cluster in the portfolio, IT Services has a 10-year average CFROI of 24.6%. Interesting to compare these numbers with the 45-strong High Quality Basket average of 28.0% - not really a million miles from the portfolio average.
Our Defensive cluster then has the same quality characteristics as the High Quality Basket. The overlaps between what we own and the HQB is primarily found in the pharma sector via Novartis, Roche and the exceptionally high returns from Novo Nordisk. RELX at an 27% average CFROI and Unilever at 25% are two others in common. Interesting to note that Nestle’s 10-year average CFROI is 19.6% and is valued on a FCFY of 3.4%. Unilever’s FCFY is 5.1% and this discrepancy explains our preferences and why we have recently been adding to Unilever.
Our holding in Zardoya Otis (elevators) is notable as a single market elevator company in the most densely penetrated elevator market in the world (Spain). It’s 10-year average CFROI of 52.4% is appreciably higher than the more widely held and much more expensive Kone and Schindler who return 42.7% and 30.0% respectively. Danone at 13% and Acomo at 18% bring down our average but we are happy they are moving in the right direction.
In our IT Service cluster there are 2 broad types of business – firstly traditional IT service companies which rent out their consultants to clients as well as write some software and secondly value-added resellers (‘VAR’s’). VAR’s re-sell other people’s hardware and software to clients usually with some form of implementation consultancy added in. The latter category has traditionally been viewed as ‘low quality’ but as an asset light model able to help clients negotiate (e.g.) big data management and shifts to the cloud, they have earned their place. The pure VAR’s we own (Proact, Atea and Digital Value) earn returns of between 27% and 45%.If you get the pure consultancy business right, very high returns can be achieved. Bouvet (recent addition), CTAC, Siili and Infotel all earn CFROI’s above 30%. Our holdings in Novabase, Innofactor and Ordina are on this journey from a much lower base, i.e., they are turnarounds.
The sharper reader will notice we haven’t addressed c.25% of the portfolio with a below average return profile. This is for another day but with an average CFROI of 19.8% they are still paying their way and compounding in our favour.
Dale Robertson & Gareth Rudd
26th August 2021


